How do you visualise all the modules in your project? What happens when you project has tens of thousands of modules? Does it look like this? Is the module namespace art?

There’s a lot of Haskell code in the world now. 1125 packages on Hackage, made up of thousands of modules, with hundreds of thousands of import dependencies between them. Some of those packages have hundreds of modules. For fun, I wanted to visualise that module namespace. That is, in one image see all the Haskell modules I could potentially use: a panoramic view of the Haskell landscape.
In this post I’m going to:
- show Iavor Diatchki’s graphmod tool for visualising module dependencies
- develop a new tool, cabalgraph, for visualising the module namespace by converting.cabal files into .dot files
- look at lots of pretty examples
- visualize the entire core and 3rd party Haskell library set in a single view
You’ll learn how to use cabalgraph and graphmod to visualise imports and namespaces, and get to see some quite cool pictures of a thousand libraries in single namespace image. (Composite image courtesy infosthetics.com who picked up the early version of this post. Thanks guys!)
Visualising by Category
Previously, I looked at comprehending Hackage through its category metadata straight from the Hackage library set. Here, font size is indicated by word size, as we view the 50 or so semantic categories used by the 1k+ Haskell packages:

Which does a reasonable job of conveying the breadth of the areas we’ve libraries and tools for. Doesn’t do much to convey the sheer number of packages now though.
The Haskell Module System
Haskell modules are pretty straight forward. You pick a hierarchical name, like System.IO.MMap, for you module name, hopefully using one of the standard top level allocated names. There are various rough guides to the namespace to try to keep things sensible. Once you’ve chosen a module name, the module itself lives in a file path of the same form. So concrete file in this case would be System/IO/MMap.hs. Others can then use my module – once it is packaged up with cabal – by importing the original name. All fairly straight forward. Modules may import each other mutually recursively too, which is fun.
Graphing Imports
At work we’ve sometimes the need to quickly convey how Haskell modules depend on each other, when trying to describe how a system works to other developers, or for verification and requirements purposes. To help with this in the context of Haskell, my colleague Iavor Diatchki, wrote graphmod, a nice way to view the module import graph of your project. Here, import statements correspond to edges, and modules are nodes. It’s easy to use (here, piping the .dot output of graphmod into graphviz to render):
graphmod *.hs */*.hs | dot -Tpng | xv -
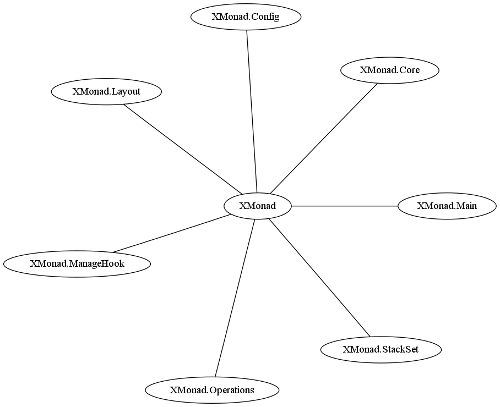
Running graphmod on the xmonad core results in:

And an alternate rendering:
For small graphs, this does a pretty good job of summarising the import dependencies of the project quickly. Useful for summarising quickly how your project works internally.
Two new tools: lscabal and cabalgraph
My goal here though was to visualise the entire Haskell module namespace. We have some nice technology at our disposal to do this:
- a single central library and tool repository, Hackage
- each package has a required declarative metadata file listing its interface (i.e. we don’t need to install it to find out what API it exports)
- a library for parsing .cabal files
So all I have to do is glue these together with a script to grab .cabal files from the network, parse them, then render them in .dot format. An hour later we have a new tool, cabalgraph. Given a list of any of: a directory with a .cabal file inside it; the path to a .cabal file; or the URL of a .cabal file, it will parse all those .cabal files, extract the module names, and then render the combined set as a graph in dot format. (Yes, a Haskell app that does network stuff, text transformation, parsing, blah blah made by gluing libraries together!). While I was here, I also put together lscabal, for just listing the exported modules from a cabal package.
Looking at lscabal first. Just running it against a project on the command line:
$ lscabal ~/dons/src/xmonad
XMonad
XMonad.Main
XMonad.Core
XMonad.Config
XMonad.Layout
XMonad.ManageHook
XMonad.Operations
XMonad.StackSet
Or viewing a remote package:
$ lscabal http://hackage.haskell.org/packages/archive/uvector/0.1.0.3/uvector.cabal
Data.Array.Vector
Or some union of these (for example, the mixed local and remote dependencies of a project):
$ lscabal http://hackage.haskell.org/packages/archive/uvector/0.1.0.3/uvector.cabal ~/dons/src/bytestring
Data.Array.Vector
Data.ByteString
Data.ByteString.Char8
Data.ByteString.Unsafe
Data.ByteString.Internal
Data.ByteString.Lazy
Data.ByteString.Lazy.Char8
Data.ByteString.Lazy.Internal
Data.ByteString.Fusion
Useful if you want to know how many, or what , modules a bunch of packages are providing. As a side note, I quite like the command line API that uniformly hands urls and filepaths intermixed. Good mashup stuff on the command line. Maybe there’s a new library waiting there…
Visualising the Namespace
We can now view the module hierarchy exported by projects, and sets of projects, graphically. In each case, I’ll pipe output into dot or one of its variants. For example:
$ cabalgraph ~/dons/src/xmonad | circo -Tpng | xv -
Results in:

And as a classic tree:

The module namespace carries a lot less information than the full import dependency graph, so we should be able to view larger projects without getting too overwhelmed.
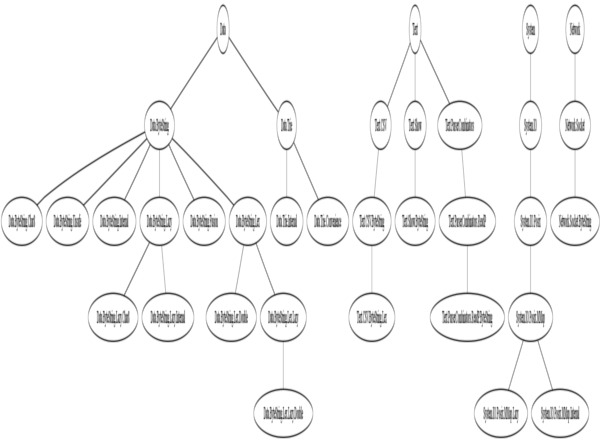
Here’s a graph of the various bytestring libraries, combined (and squashed horizontally) (here’s the original widescreen version):

So there’s a bit of a culture that’s built up around the bytestring library.
Big Graphs: Getting a bit artsy
Here’s a rather cool image of the xmonad extensions library (all the extra layouts , and buttons and tweaks). The xmonad core (visualized above) is just one tiny circle with all this surrounding code built on top:

xmonadcontrib is very well regulated, and growing smoothly.
Here’s a rendering of the darcs module namespace:
 And a graph of most of the libraries that I’ve written:

Here is the Haskell core library namespace (aka the standard libraries). Note how sparsely connected the core “axiomatic” libraries are:

The Haskell Universe
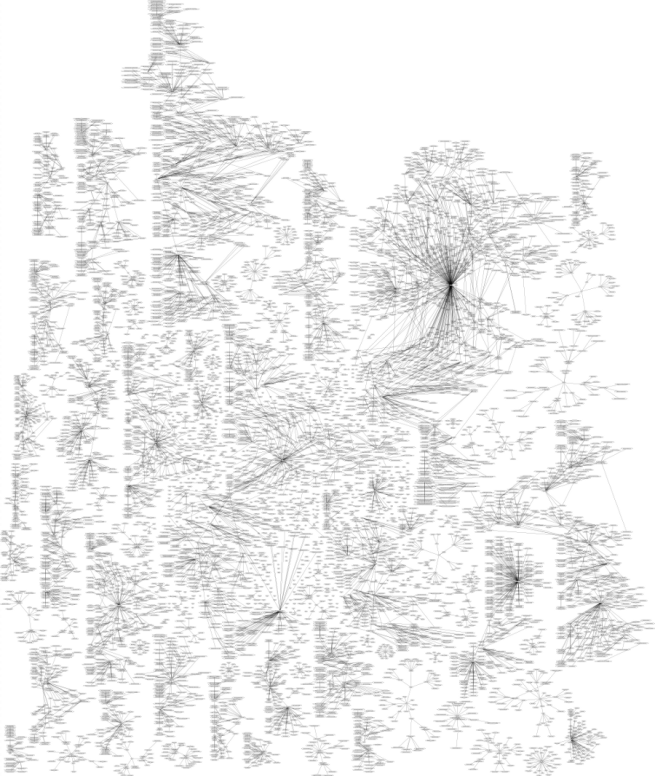
And without further ado, here it is: the complete Haskell namespace (every open source Haskell module available via Hackage or the core libraries (the vast majority of public and open Haskell code in existence)):

It’s kind of beautiful. You see the big parts of the namespace (like “Data”, “System”, “Control” and “Text”) have lots of modules under their control, so much so that the modules become a fuzzy cloud of black. Then there are smaller parts of the namespace, until we’re just looking at single, freestanding modules not connected to any other part of the namespace. So much code.
Here’s an alternative rendering using the “force directed” spring algorithm dot provides. The individual modules are a bit more distinct now:

It’s almost like a star chart. Here’s another rendering, using “neato” mode. It emphasises the more massive parts of the namespace a bit more:
 This one is like looking down on the namespace from above. A topological map almost, where you can see the big peaks of the namespace.
The final image is perhaps the most revealing. Here you see the big parts of the namespace, and each individual project hanging off as tiny sprouts. Vaguely biological looking:

You can try rendering this graph yourself using these .dot files constructed with cabalgraph, and some .svg files for the big images (rather then rendering big .pngs for them).
The general process I used here was cabalgraph to construct the big dot files, then graphivz to generate various renderings, with inkscape and gimp at the end to get them into a .png format.
Hope you enjoyed all that.

That’s really cool. :-)
Next step is where the graph becomes interactive and I can zoom in. :-P
Cool!
Nice! But what I would really like to do is look WITHIN a module and see how functions depend on one another. Then integrate the graph generation with the output from the profiler, and you get a really clear visual representation of bottlenecks in your code.
What a wonderful abstract masterpieces,you have done of “The Haskell Universe”
@jberryman: You can zoom in and out of the SVG files that were listed. Probably the most useful is at http://code.haskell.org/~dons/images/svg/hackage-fdp.svg
I’d say I want that last one (the circo one) as a poster, but it’d be way out of date by the time it got to me…
Haskell grows so fast…
That is pretty cool alright. That big graph with the “clouds” is seriously cool!
Your “cabalgraph” app seems similar to part of what my SourceGraph app does (which I’m going to extend and fix up, as soon as Matthew Sackmann approves my changes to his graphviz library).